
Table of Contents
ToggleResolving deadlocks using SQL Server performance monitoring
What should you do if you believe deadlocks are happening on your SQL Server instances? We’ll look at three techniques to detecting and resolving deadlocks, each of which includes getting the information characterizing the deadlock, specifically the stalemate graph, and provide SQL services Resources to save your time and effort.
Method 1 of Traceflag 1222
There was a time when enabling trace flag 1222 (or 1204 on SQL 2000) to record the deadlock graph was the only method to obtain it. Figure 1 depicts the error log contents, highlighting the process chosen as the deadlock victim and displaying the deadlock graph output above it.
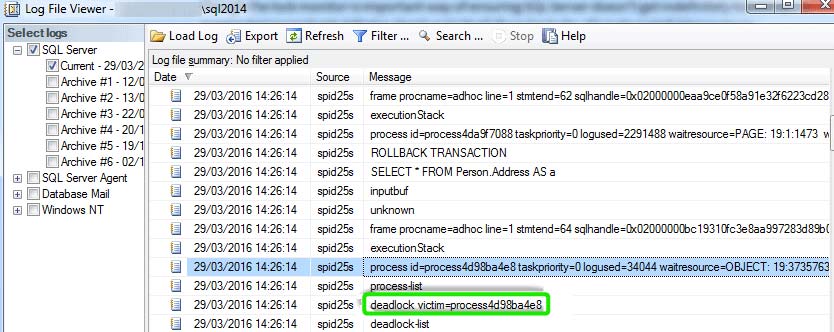
However, unless you have the traceflag set permanently, you’d need to activate it and wait for the impasse to reoccur. SQL Server generates a large amount of information in the error log, and there is still a lot of manual work for the DBA to perform in determining which sessions and resources (tables, indexes) are involved in the deadlock. Only utilize this strategy if you have no other options.
Method 2 for Extended Events
The system_health extended event session is enabled in response to a 1205 error notice, you may get it retroactively by performing a T-SQL/XPath query (e.g., see Listing of Gail Shaw’s article) or by utilizing the Extended Events UI target data viewer in SSMS, as illustrated in Figure 2.
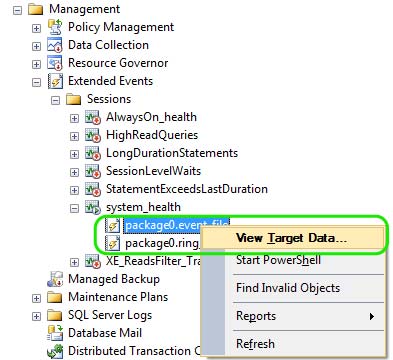
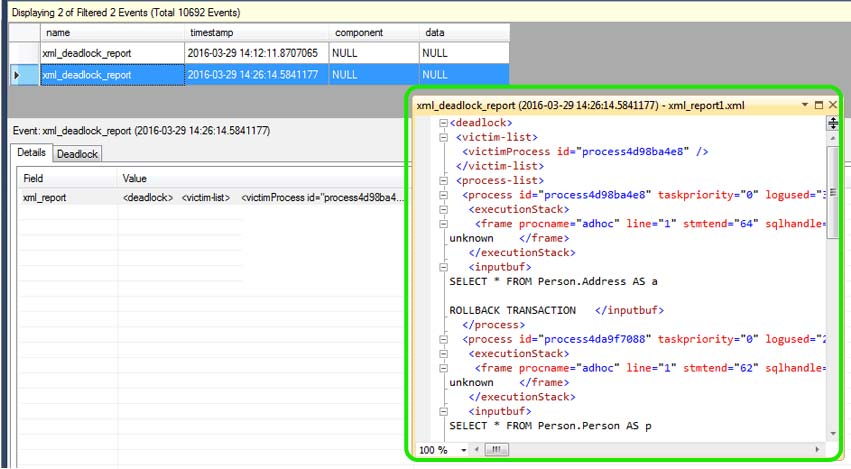
There may be hundreds of events displayed, but right-click on the data viewer and select Filter by this Value to create a filter on the name column so that the viewer displays an event only if it “Contains” the value “deadlock.”
We may inspect the deadlock graph in either XML (Details tab) or graphical form (Deadlock tab) by clicking on an xml_deadlock_report event in the data viewer.
Method 3 for SQL Monitor
An SQL Server performance monitoring tool, such as SQL Services by IT Company, seeks to provide the DBA with enough information to resolve a deadlock without delving too deeply into an XML deadlock graph, and it does so within the context of the server’s general pattern of activity at the moment. Not only does this make debugging the deadlock easier, but it also makes performance troubleshooting more successful overall.
It identifies deadlocks automatically and sends an alert to your mailbox. The upper half of the Details tab on the alert page in SQL Monitor provides the sessions, queries, and database objects involved in the deadlock in an easily readable format.
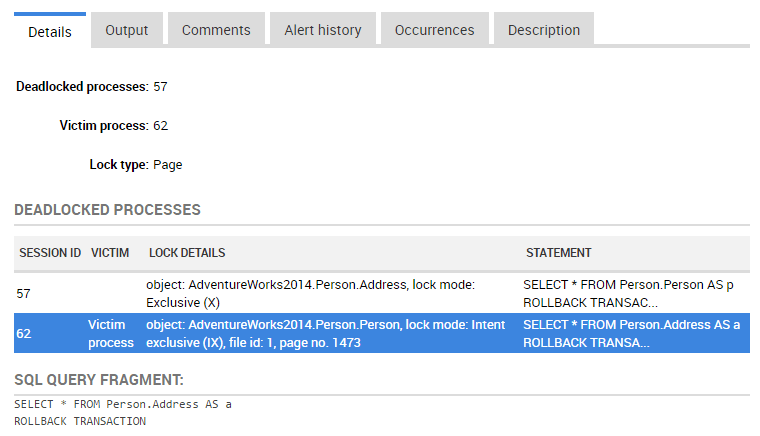
Session 57 gets an exclusive (X) lock on the Person.Address table in order to update it before reading from Person.Person. Session 62 acquires an X lock on the Person.Person table in order to update it, then reads from the Person.Address table. The SELECT in session 57 cannot progress due to the X lock in session 62, and the SELECT in session 62 cannot proceed due to the X lock in session 57.
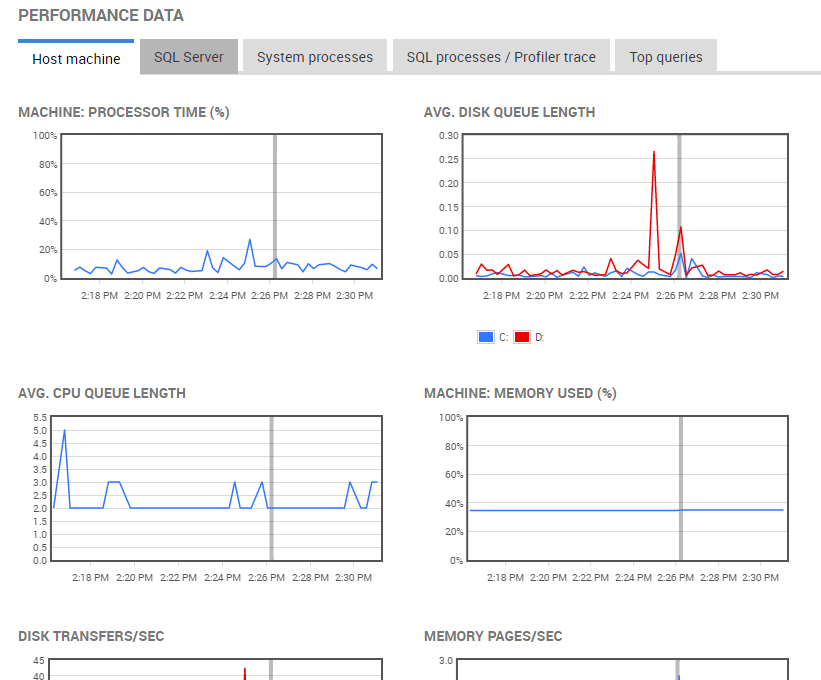
The performance data graphs in SQL Monitor
The Top Queries page will provide the plan handle for the statements implicated in the impasse, allowing you to get their execution plans if query optimization is necessary to address the issue (which is frequently the case!).
In this scenario, possible options include rewriting the transactions so that they access tables in the same sequence, or performing the transactions with the READ COMMITTED SNAPSHOT or SNAPSHOT isolation levels, where readers do not accept Shared locks.
Conclusion
Finally, resolving SQL Server deadlocks effectively is critical for assuring continuous database operations. Businesses may easily manage deadlock challenges with the help of our IT company’s SQL services. Our team of experts has the technical skills and experience to deal with deadlock problems quickly and efficiently.
Contact us swiftly to have our SQL professionals optimize your database operations, providing a smooth and effective workflow for your company. See how our SQL services can help you resolve deadlocks and optimize your SQL Server setup for remarkable speed and dependability.